What a Boring Log Looks Like: Real Examples
Eight actual boring logs from state transportation departments — different decades, different forms, one of them a complete 51-page foundation report — each viewable and downloadable as a PDF. Below the examples is a column-by-column guide to reading one. All are drawn from the 2,300,000+ public logs on Geosetta; each links to its location on the map.
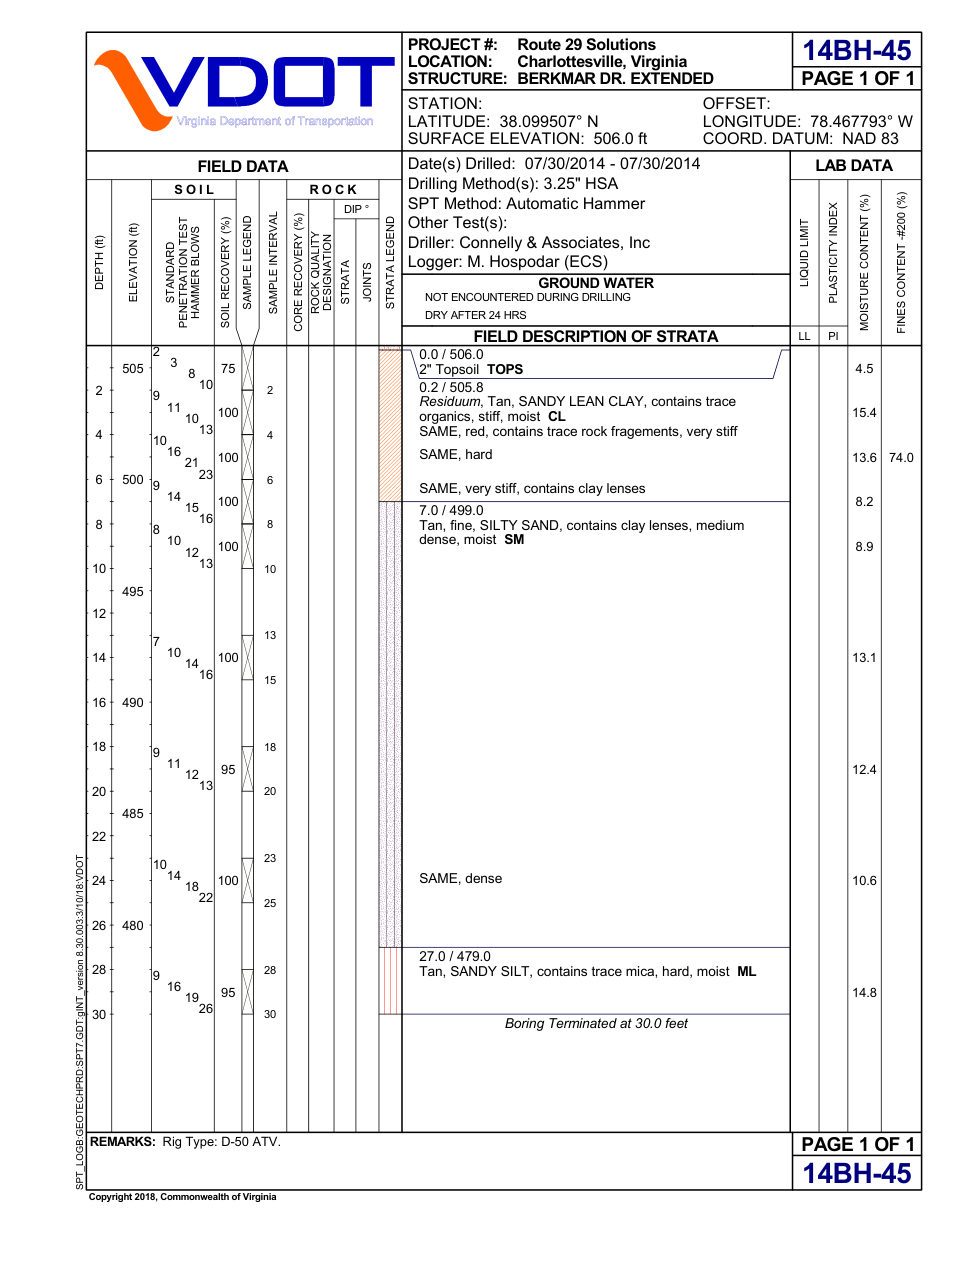
Modern DOT boring log (VDOT, 2014)
The format most engineers see today: a gINT-style sheet with project, station, coordinates and ground elevation in the header; then depth, sample number and type, blows per 6 inches with the N-value, recovery, a plain-language soil description with the USCS symbol, the groundwater reading, and lab results (moisture, liquid and plastic limit) down the right.
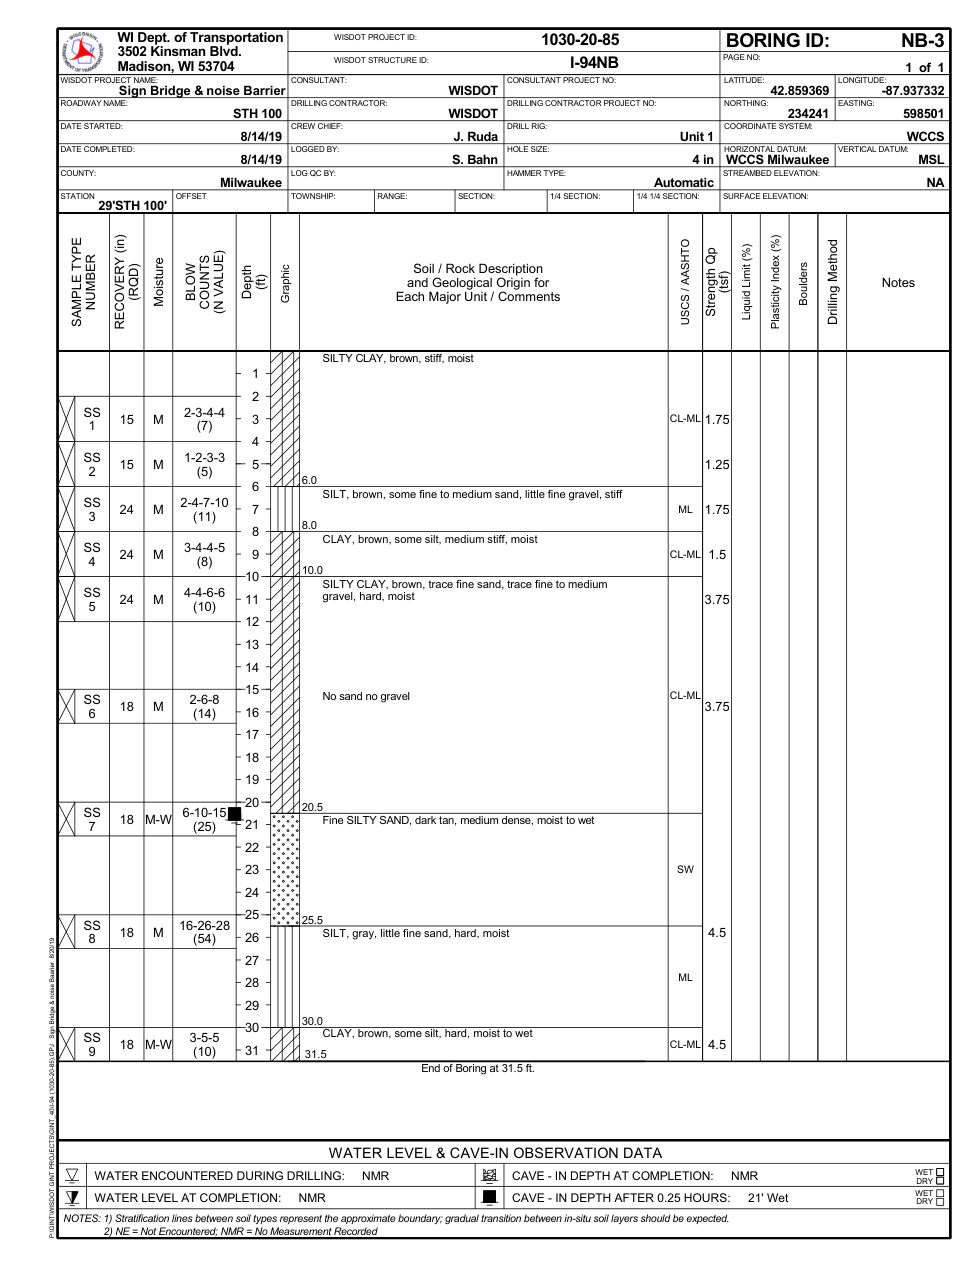
DOT boring log with graphic soil column (WisDOT, 2019)
Same information as the VDOT log, arranged around a hatched graphic column that shows the strata at a glance. Look for the boring ID and elevation in the header, the N-values next to each sample, and the water-level observations at the foot of the page.
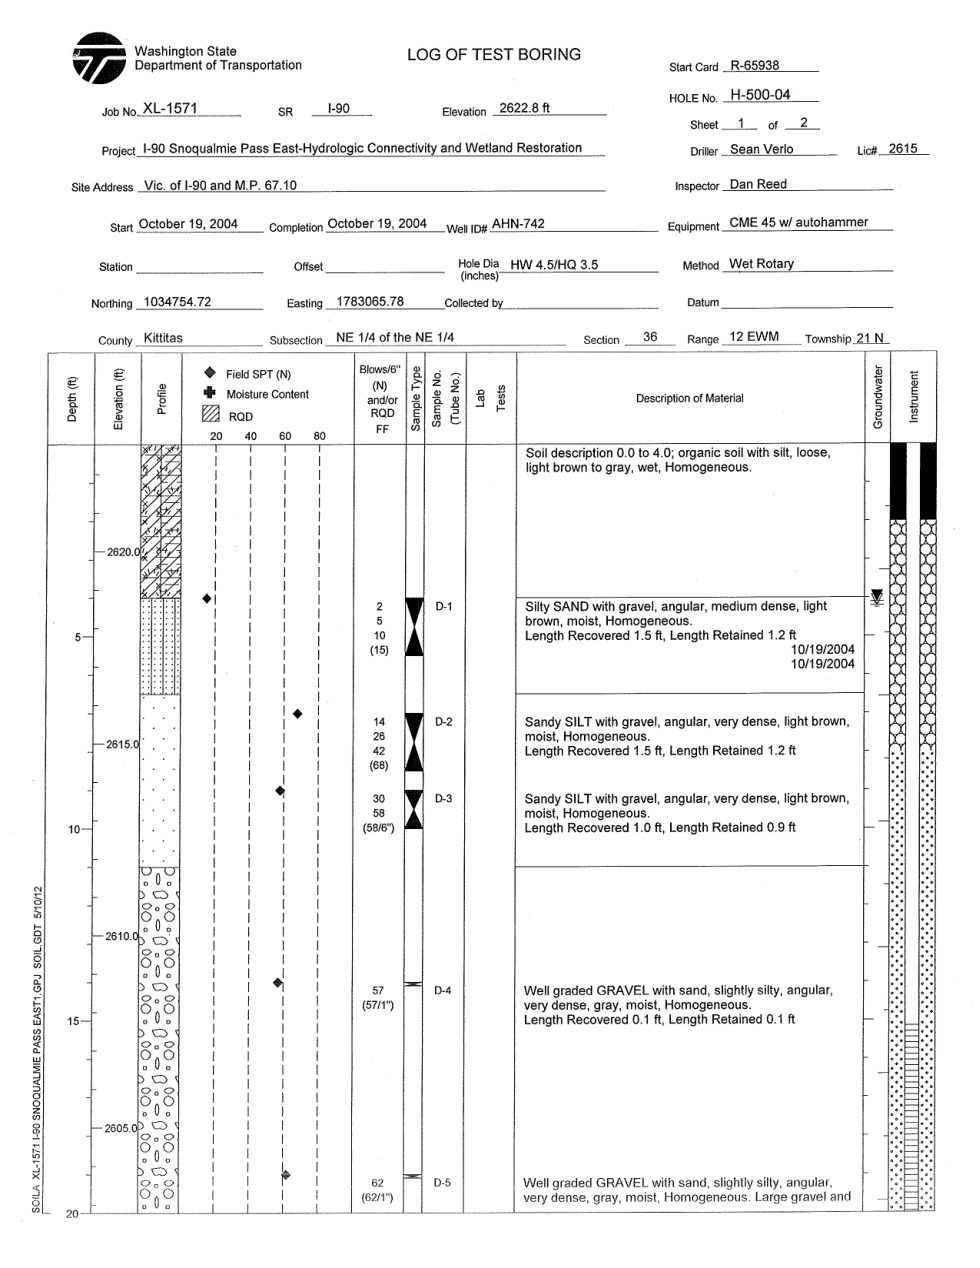
Log of test boring with plotted blow counts (WSDOT, 2004)
WSDOT plots each SPT result as a point against depth, so a stiff or dense layer reads as a jump in the curve before you read a single number. Sample symbols mark where split-spoon and other samples were taken.
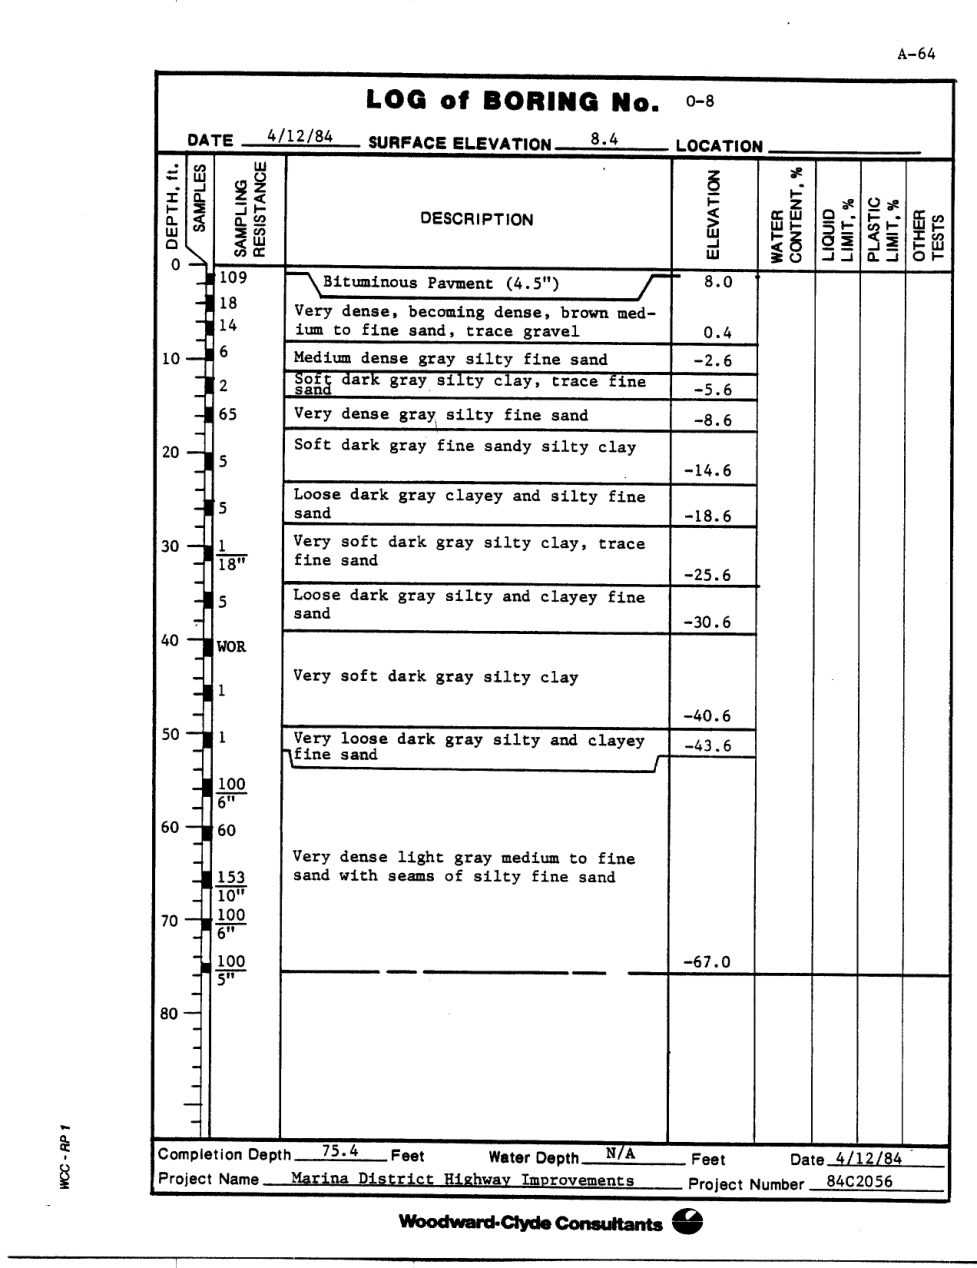
Consultant "Log of Boring" (Woodward-Clyde for NJDOT, 1984)
A classic consultant format from the era before CAD logs: typed descriptions, elevations in the margin, sample intervals as bars, blow counts, and the water level noted at completion. Seventy-five feet of coastal-plain sands and clays on one sheet.
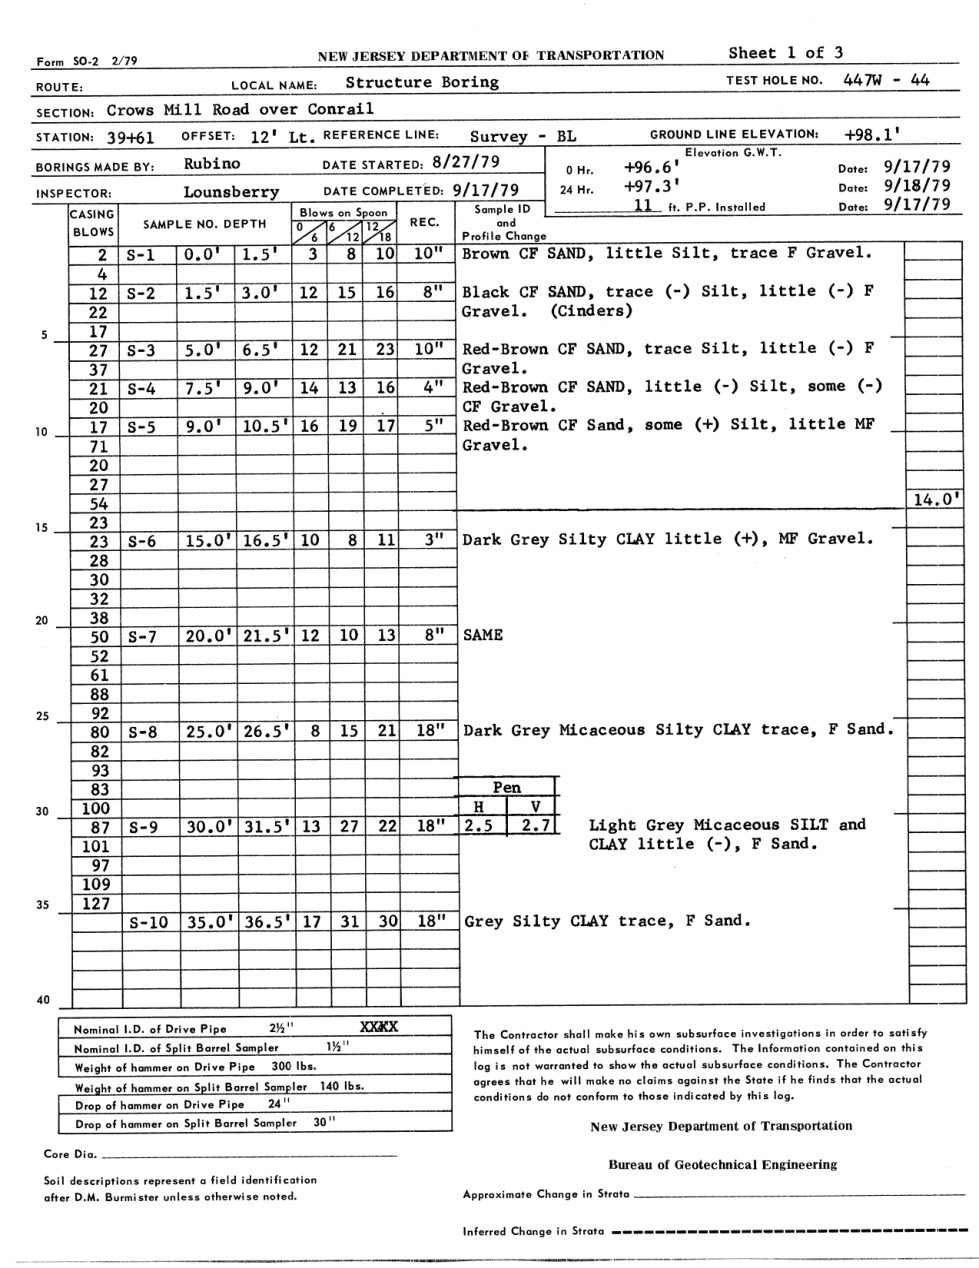
State "structure boring" form for a bridge (NJDOT, 1979)
Bridge foundations get their own form. Blows are logged per 6-inch increment in three columns, sample numbers run down the left, and the sheet is one of three for the structure — a reminder that a "boring log" is often one page of a set.
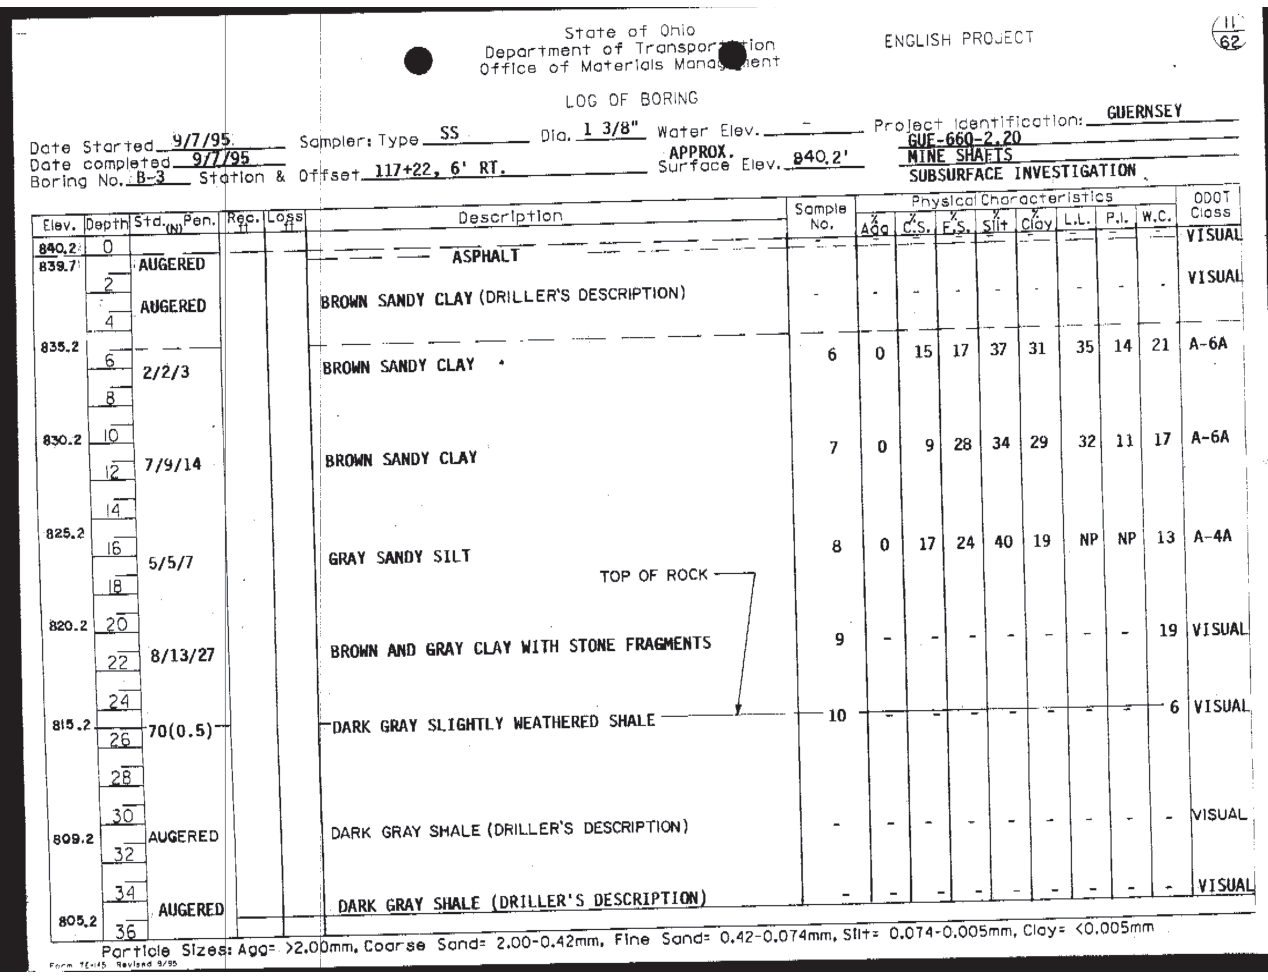
Scanned field log, as most archived logs look (Ohio DOT, 1995)
Most public boring logs are photocopies of hand-completed sheets like this one. The columns are the same as on a modern log; the skill is in reading handwriting and abbreviations ("SS" for split spoon, "N" for the blow count). This is what Geosetta digitizes at scale.
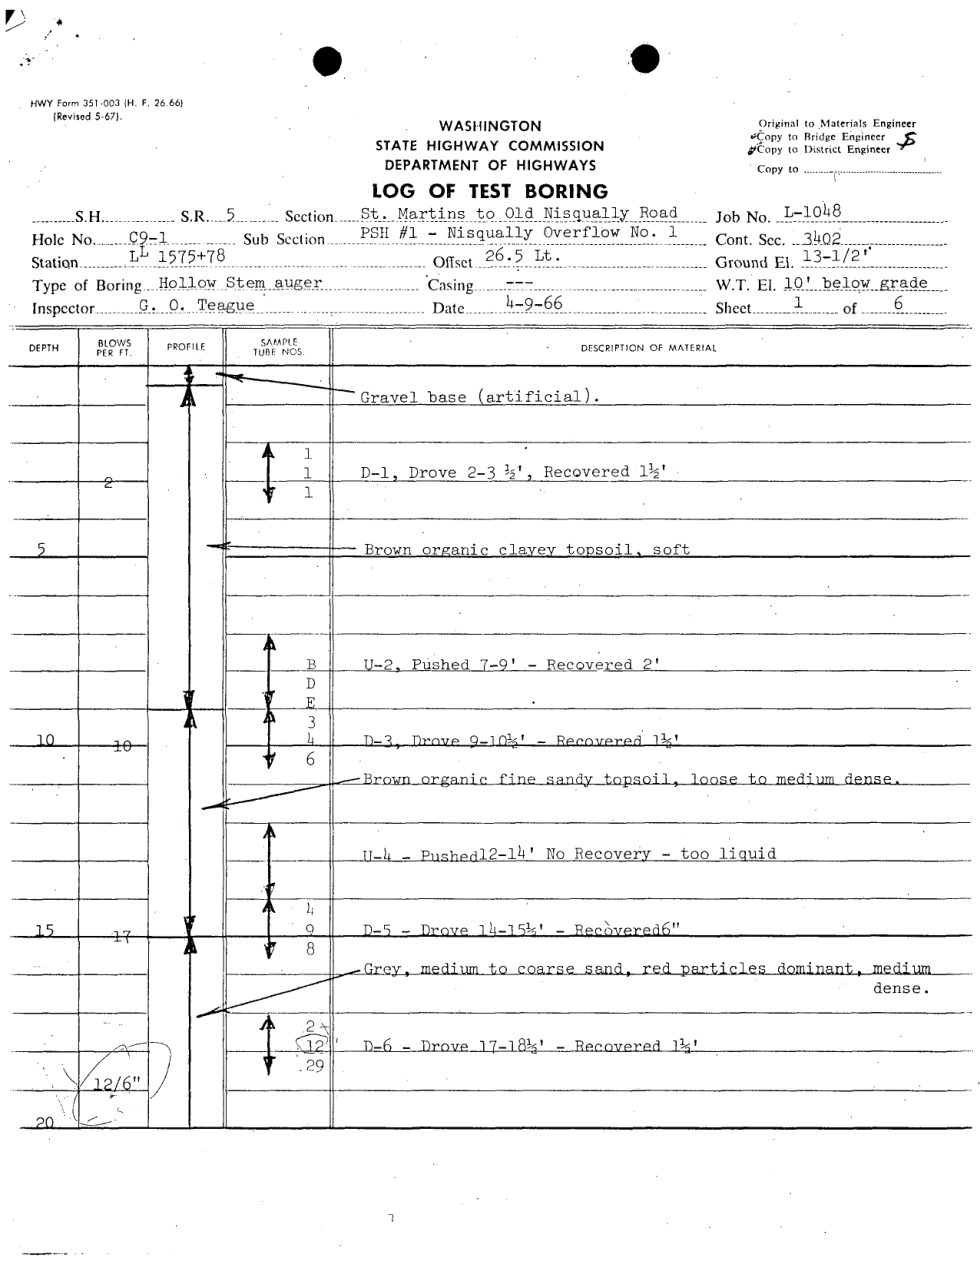
Mid-century typed log (Washington State Highway Commission)
A 123-foot hole logged on a typewriter. Sample depths, recovery and descriptions are all there; blow counts appear as notes rather than a column. Old logs like this are still valuable: the ground has not changed, only the paperwork.
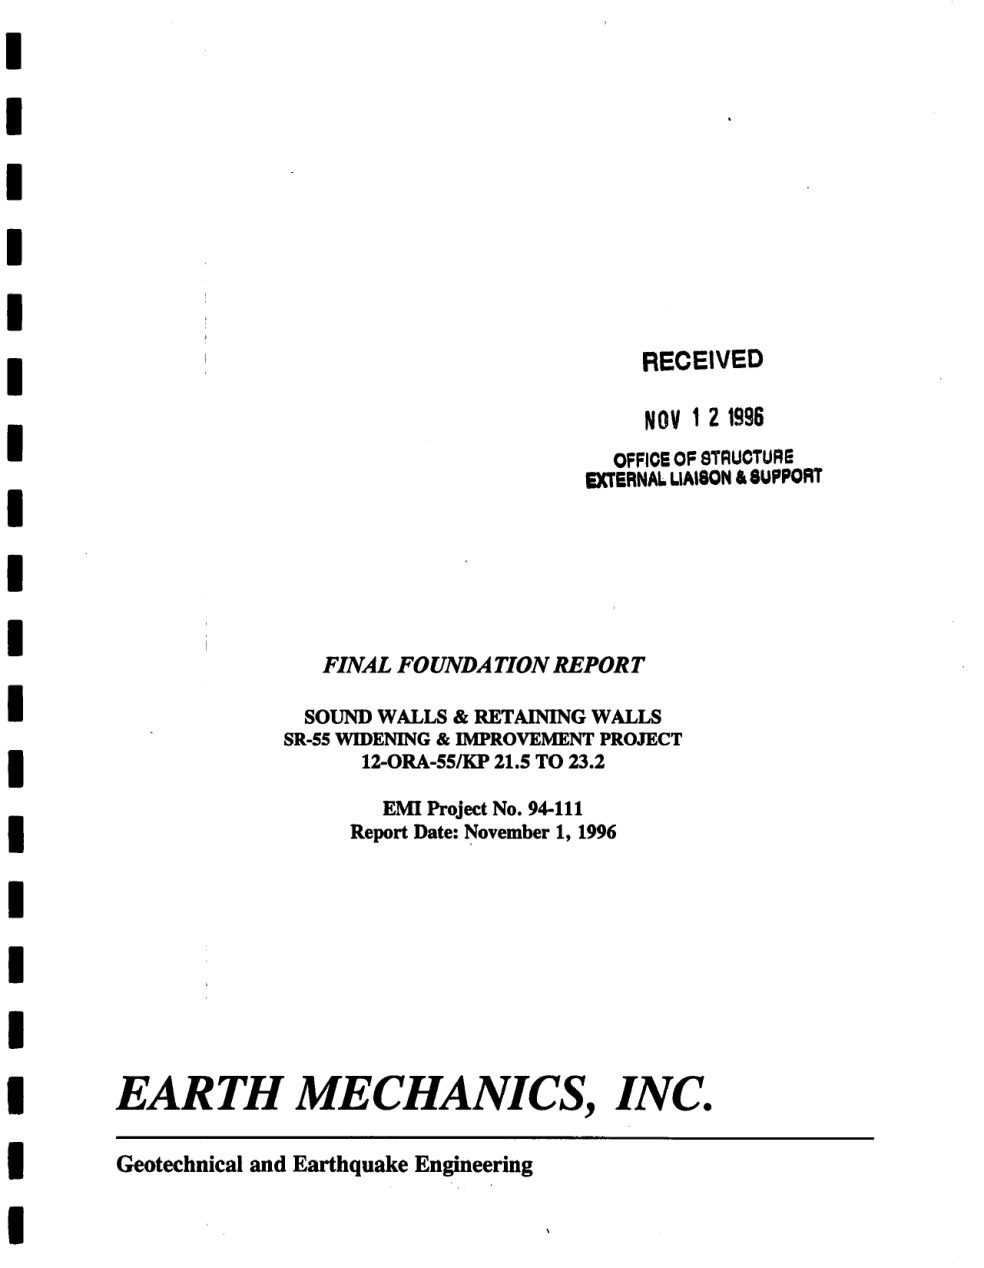
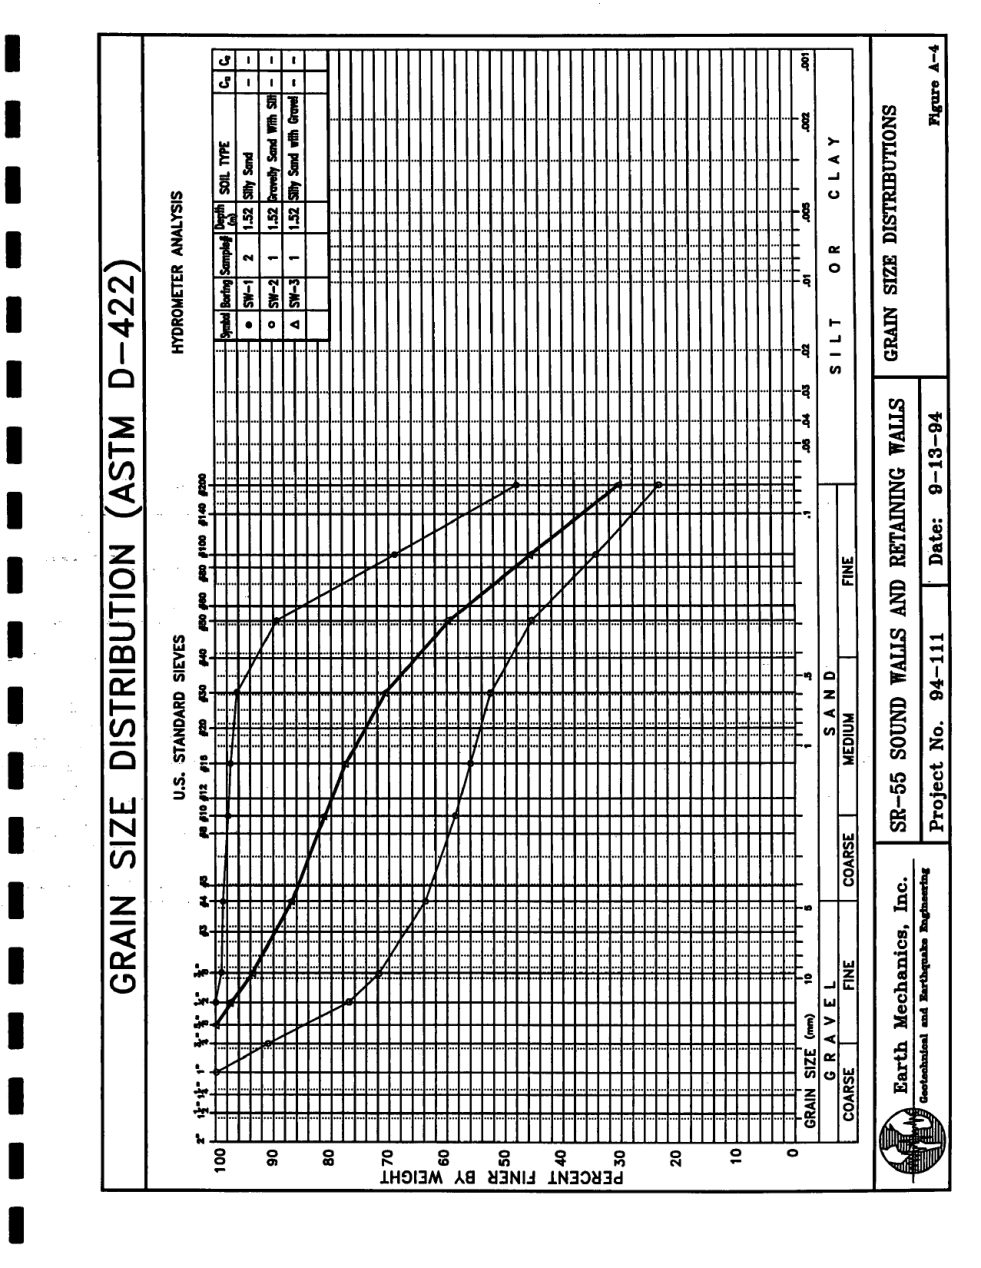
Complete foundation report, 51 pages (Earth Mechanics for Caltrans, 1996)
A boring log is one exhibit inside a soil investigation report. This one has the cover and transmittal, narrative sections on corrosivity and earthwork, the boring logs, and an appendix of lab results such as the grain-size distribution curve shown here. If you searched for a "soil investigation report sample", this is the shape.
How to read a boring log
Forms vary, but almost every log carries the same nine things. Find them in this order and the rest falls into place.
1. Header
Project, boring number, date, location (station/offset or coordinates), ground elevation, drilling method and hammer type, and who logged it. Elevation is the item most often missing — and the one you need to tie logs together.
2. Depth column
Depth below ground surface, usually in feet in the US. Some logs also show elevation alongside so strata can be read directly as elevations.
3. Samples
Where samples were taken and how: SS (split spoon, disturbed), ST (Shelby tube, undisturbed), core runs in rock. Recovery tells you how much of the interval came back.
4. Blow counts and N-value
The Standard Penetration Test: blows to drive the sampler each of three 6-inch increments (e.g. 4-6-8). N is the sum of the last two (14). Very loose sand is N<4; very dense is N>50. "50/3"" means refusal — 50 blows for 3 inches.
5. Soil description
Consistency or density, colour, moisture, principal soil type and modifiers ("Stiff, brown, moist, silty CLAY, trace sand"), often with the USCS symbol (CL, SM, GP…). Strata changes are marked by lines or a graphic column.
6. Groundwater
A triangle symbol (▽ or ▼) at the depth water was encountered during drilling and, if measured, at completion or 24 hours later. Seasonal and method-dependent — read the note.
7. Rock
Where the boring reaches rock: rock type, weathering, core recovery (%) and RQD (rock quality designation, the percentage of core in pieces longer than 4 inches).
8. Lab results
Moisture content, Atterberg limits (LL/PL/PI), grain-size (percent fines), sometimes unconfined strength — either in right-hand columns or in a report appendix.
9. Remarks
Caving, drilling fluid loss, hammer energy, offsets, anything odd. Read them; they qualify everything above.
Boring log vs. soil investigation report
A boring log records one hole. A geotechnical (soil) investigation report is the engineer's document built on many of them: site description, the logs as exhibits, lab results, a subsurface profile or cross-section, and recommendations for foundations, earthwork and groundwater. The Caltrans example above is a complete report; the others are individual logs that would sit in an appendix. Geosetta holds both: single logs, and 2.3 million log locations pulled from thousands of full reports.
Get boring logs as data, not just PDF
Every digitized boring on the map downloads as the original PDF, as DIGGS XML (open it in the browser viewer) or as AGS4, and the same data is available through the API. Have your own PDF logs? The Boring Log Extractor turns them into DIGGS data. Browse logs by place on the data by state pages.
DIGGS ValidatorAGS ↔ DIGGS ConverterBoring Log ExtractorDIGGS Viewer
These logs are public records republished as received from the agencies named; Geosetta has not verified them. They illustrate what a boring log contains and are not a substitute for a site investigation. See the terms and disclaimer.